Loyalty programme ROI: a CFO-ready guide for UK hospitality
Loyalty programme ROI: a CFO-ready guide for UK hospitality

Loyalty programme ROI has one defensible formula: ROI = (Incremental net profit − total programme cost) ÷ total programme cost × 100. The word that does all the work is incremental. It means the revenue your members generated above what a matched group of non-members would have spent anyway, not the gross total of every transaction a loyalty card holder ever made. Get that distinction wrong and your ROI figure will fail the first finance review it faces.
Before you open a spreadsheet, you need five numbers:
- Member revenue for the measurement period (from your EPOS or CRM)
- Control-group revenue for the same period (a matched cohort of non-enrolled customers)
- Gross margin or contribution % so you can convert revenue lift to profit
- Total programme cost across all four ledger lines (see Section 4)
- Measurement period in months (90 days minimum; 12 months for a full business case)
On the cost side, four lines must appear on the ledger or finance will send the model back: points and reward liability, platform and technology subscription, fulfilment costs, and internal staff and operations time. Under IFRS 15, points issued at the point of sale are a deferred revenue obligation sitting on the balance sheet until redemption or expiry. Omit that liability and your ROI is overstated before the meeting has started.
One more framing point worth stating plainly: engagement metrics alone do not convince a CFO. Enrolment counts, redemption rates, and total member revenue describe activity. Incremental spend, payback period, and total cost of ownership (TCO) prove the business case.
Table of Contents
- Which KPIs does a CFO actually want to see?
- How to calculate loyalty ROI step by step
- What does a complete cost model look like, and when does it pay back?
- Tactics that genuinely move the ROI needle
- How to present loyalty ROI in management reports and QBRs
- Common measurement mistakes that overstate ROI
- How Pintup’s design maps to better ROI for UK cafés, pubs and salons
- Key takeaways
- The gap between loyalty metrics and financial proof
- Run a low-cost pilot and get CFO-ready numbers fast
- Useful sources and further reading
Which KPIs does a CFO actually want to see?
Finance teams work from a short list of metrics that map directly to the profit-and-loss account and balance sheet. The table below defines each one, shows where it sits in the accounts, and gives a quick calculation note so you can pull the figure from a CRM or EPOS export.
| KPI | What it measures | Where it sits | Quick calculation |
|---|---|---|---|
| Incremental revenue | Member lift vs control group | P&L numerator | (Member avg spend − Control avg spend) × active members |
| Retention lift | % point improvement in 12-month retention | P&L (CLV impact) | (Member retention rate − Control retention rate) |
| AOV uplift | Basket size increase vs non-members | P&L numerator | Member avg transaction − Control avg transaction |
| Purchase frequency | Visits per member per period | P&L numerator | Member visits ÷ active members over period |
| Active member rate | Members who transacted in last 90 days | Engagement health | Active members ÷ total enrolled × 100 |
| Points liability | Deferred revenue on unredeemed points | Balance sheet | Points issued × point value − redeemed to date |
| Breakage rate | Points that expire unused | P&L (revenue release) | Expired points ÷ total issued × 100 |
| Blended CAC | Cost to acquire one active member | P&L cost line | Total acquisition spend ÷ new active members |
| Payback period | Months to recover total programme cost | Cash flow | Total programme cost ÷ monthly incremental net profit |
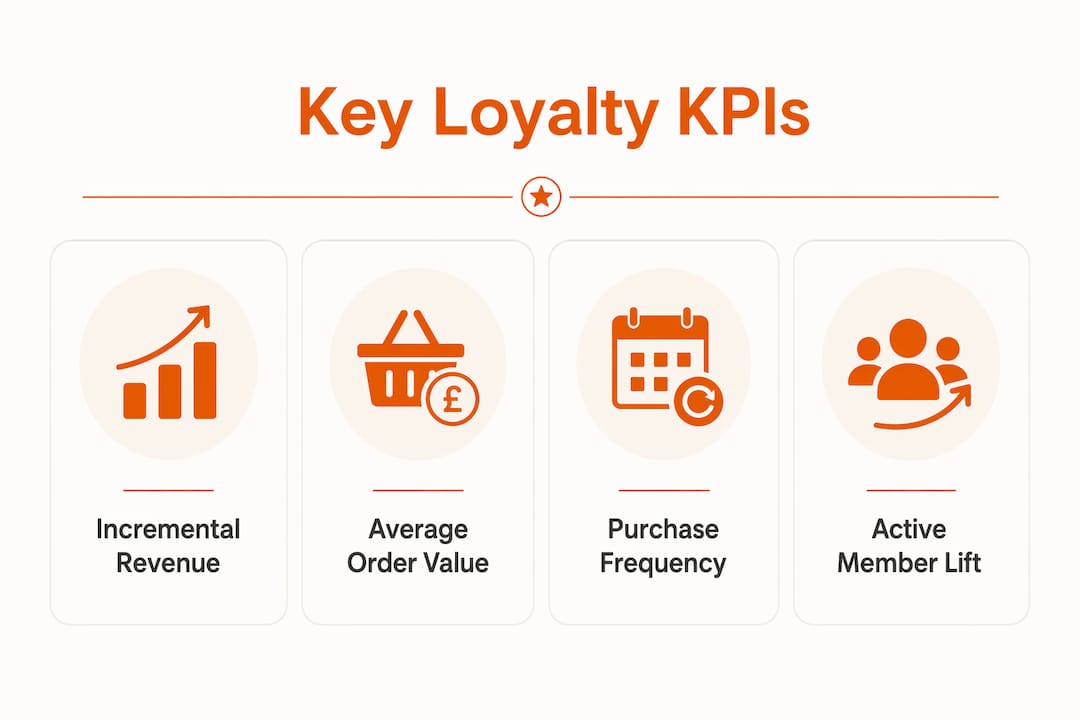
A few points on how these feed the accounts. Incremental revenue, AOV uplift, and purchase frequency all flow into the numerator of your ROI formula. Points liability is a balance-sheet item until redemption, at which point it converts to a cost. Breakage reduces that liability over time and gets recognised as revenue, which is why modelling breakage conservatively reduces the risk that your ROI depends on members not redeeming. Blended CAC and payback period are the two figures a finance director will reach for first when deciding whether to scale.
Most operators over-index on enrolment numbers. The defensible comparison is always active-member lift versus a matched control group. That gap is where the real incremental revenue lives.
How to calculate loyalty ROI step by step
The core formula is: Incremental Revenue = (Member Average Spend − Control Average Spend) × Number of Active Members. Multiply that by your contribution margin to get incremental net profit, subtract total programme cost, and divide by total programme cost.

Here is a worked UK example for a café group with three sites.
Inputs (12-month period):
| Line item | Value | Source |
|---|---|---|
| Active members | 800 | Loyalty back office |
| Member avg annual spend | £420 | EPOS / CRM |
| Control group avg annual spend | £290 | EPOS (matched non-members) |
| Contribution margin | 62% | Management accounts |
| Platform subscription | — | Supplier invoice |
| Reward fulfilment cost (net of 25% breakage) | — | Loyalty back office |
| Staff and operations | — | Internal time log |
| Total programme cost | £3,900 | Sum of above |
Calculations:
- Incremental revenue: (£420 − £290) × 800 = £104,000
- Incremental net profit: £104,000 × 62% = £64,480
- ROI: (£64,480 − £3,900) ÷ £3,900 × 100 = 1,553%
- Payback period: £3,900 ÷ (£64,480 ÷ 12) = 0.7 months
The payback figure looks dramatic because platform costs are low for a small venue. In practice, Year 1 ROI is often lower once you include launch marketing and the member ramp-up period. A three-year financial model is the right frame for a CFO presentation: Year 1 covers investment and ramp-up, Years 2 and 3 capture the compounding retention benefit.
How to build the spreadsheet:
- Create columns: Period, Active Members, Member Avg Spend, Control Avg Spend, Contribution %, Incremental Revenue, Incremental Net Profit, Platform Cost, Fulfilment Cost, Staff Cost, Total Cost, ROI %, Payback (months).
- Lock the control-group average in a reference cell so it does not drift as you update member data.
- Add a breakage assumption cell (start at 20–25% for a café stamp card) and link it to the fulfilment cost line.
- Build three scenarios: conservative (attribution fraction 40%), base (60%), and optimistic (80%) to show the CFO how robust payback is to your assumptions.
- Sanity check: if your incremental revenue is more than 30% of total member revenue in Year 1, revisit your control-group match quality.
What does a complete cost model look like, and when does it pay back?
Four cost lines belong on the ledger. Miss any one and the ROI figure will not survive a finance review.
- Points and reward liability: the deferred revenue obligation created when a point or stamp is issued. Under IFRS 15, this sits on the balance sheet until redemption or expiry. Loyalty programmes can act as earnings buffers by adjusting point values relative to operating performance, which means the liability is not static.
- Platform and technology subscription: monthly or annual SaaS fee, plus any integration or set-up costs. For most small UK venues, this is the most predictable line.
- Fulfilment costs: the actual cost of the reward delivered at redemption, net of breakage. Breakage rates for café and hospitality stamp cards typically sit at the lower end of the 5–30% range seen across programme types.
- Staff and operations: programme management time, customer service queries related to the programme, and any campaign execution hours. This line is the one most commonly omitted from small-business models.
On payback timelines: many programmes show negative or breakeven returns in Year 1, and that is normal. The retention compounding effect takes time to appear in the P&L. Plan for a 12–24 month payback horizon for a well-run small hospitality programme, with stronger positive returns in Years 2 and 3 as fixed costs spread across a growing active member base. Factors that shorten payback include a high-frequency venue (daily coffee visits beat monthly haircuts), a low platform cost, and a high contribution margin. Factors that stretch it include heavy launch marketing spend and a slow member ramp.
Budget submission checklist:
- Platform subscription (monthly × 12)
- Reward fulfilment cost (estimated redemptions × reward value × (1 − breakage rate))
- Staff time (hours per month × blended hourly rate × 12)
- Launch and acquisition marketing (one-off or amortised over Year 1)
- Points liability balance at period end (for the balance sheet note)
Tactics that genuinely move the ROI needle
BCG’s research on the loyalty margin shows that programme design, particularly tiering and reward structure, drives incremental share when it is aligned to margin. The tactics below map to the five financial levers: retention, AOV, frequency, CAC reduction, and data value.
- Deep personalisation targets the retention and AOV levers. McKinsey found that personalised loyalty pilots deliver a 2–4 percentage point improvement on gross margin versus standard mass offers. For a café or salon, this means birthday rewards and spend-threshold triggers rather than a flat “tenth visit free” mechanic.
- Friction-free redemption protects frequency. Every extra step between earning and redeeming a reward reduces active member rate. QR-code-based programmes with no app requirement remove the biggest friction point for local venues.
- Tiered rewards lift AOV. When a higher tier unlocks a meaningfully better reward, members spend more per visit to reach it. The key is setting tier thresholds at a level that stretches behaviour without feeling unattainable.
- Referral mechanics cut CAC. A member who refers a friend costs a fraction of a paid acquisition channel. Member spend frequency and basket size both tend to increase with programme maturity, and referred members often mirror the behaviour of the referrer.
- Targeted re-engagement campaigns recover lapsing members before they churn. An automated email triggered at 45 days of inactivity costs almost nothing to run and directly improves retention rate, the highest-value lever because of how it compounds into CLV.
- First-party data activation improves paid media efficiency. A clean customer database lets you build suppression lists and lookalike audiences, reducing wasted ad spend and improving blended CAC.
90-day optimisation sprint (priority order):
- Confirm your control group is in place and matched before any new campaign
- Activate automated re-engagement emails for members inactive for 45+ days
- Add a referral link to post-visit communications
- Review tier thresholds against actual spend distribution and adjust if fewer than 15% of members are reaching Tier 2
- Pull breakage data and reconcile against points liability monthly
Retention lift is typically the highest-value lever because even small percentage improvements compound into outsized profit impact over a 24–36 month window, depending on your margin structure.
How to present loyalty ROI in management reports and QBRs
Lead every finance presentation with three numbers: headline ROI %, payback period in months, and TCO for the period. Everything else is supporting evidence.

Recommended dashboard structure:
| Metric | Cadence | Owner | CFO trigger |
|---|---|---|---|
| Incremental revenue vs control | Monthly | Marketing / Loyalty | Primary ROI input |
| Active member rate | Monthly | Loyalty | Engagement health |
| AOV uplift vs non-members | Monthly | Marketing | Revenue lever |
| Points liability balance | Monthly | Finance | Balance sheet |
| Breakage rate (rolling 90 days) | Monthly | Finance | Cost reconciliation |
| Payback period (cumulative) | Quarterly | Finance | Investment decision |
| CLV delta (member vs control) | Quarterly | Marketing | Long-term value |
| Sensitivity scenario update | Quarterly | Finance | Risk framing |
For the quarterly business review, present three scenarios rather than a single point estimate: conservative (lower attribution fraction, higher breakage), base, and optimistic. Show the payback period under each. A CFO who sees a range of 8–18 months across scenarios has far more confidence in the model than one who sees a single “14 months” with no uncertainty range. Frame the programme as a multi-year investment with a clear path to payback, not a one-year line item.
On the monthly cadence, reconcile points issued, redeemed, and expired so finance can track how the liability is converting to cost over time. That running reconciliation is what separates a loyalty team that finance trusts from one it does not.
Common measurement mistakes that overstate ROI
Counting gross member revenue as incremental. This is the most common error. Members who enrolled were often already your best customers before they joined. Gross revenue overstates return by conflating existing spend with the lift the programme actually caused. The correction is always to compare against a matched control group, or to apply an explicit, disclosed attribution fraction.
Omitting points liability from the cost model. Under IFRS 15, points issued are a deferred revenue obligation. Leaving them off the cost side makes the programme look cheaper than it is. Finance will add them back in the review meeting.
Ignoring cannibalisation. High-value customers self-select into loyalty programmes. If your control group is not properly matched for pre-enrolment spend, you will attribute their existing high spend to the programme. The verification test: compare the pre-enrolment spend of enrolled members against the control group. If members were already spending 20% more before joining, your attribution needs adjusting.
Failing to use a control group. An explicit attribution fraction is an acceptable substitute when a control group is genuinely unavailable, but commit in writing to replacing it with a measured holdout within 12 months. A finance reviewer will ask.
Excluding operations costs. Staff time managing the programme, handling customer queries, and running campaigns is a real cost. It is also the line most likely to be omitted from a first-draft model. Add it, even as an estimate.
Pro Tip: Run a 90-day pilot with an explicit holdout group before full rollout. It limits downside, generates owned evidence, and converts the budget conversation from a theoretical argument into a low-risk experiment with real data.
How Pintup’s design maps to better ROI for UK cafés, pubs and salons
Pintup is built around the features that reduce pilot cost and generate the measurement inputs a finance team will expect. Here is how the product maps to the five financial levers and the four cost lines.
| Pintup feature | Financial lever | Cost line it reduces |
|---|---|---|
| QR-code digital stamp cards (no app or hardware) | Frequency, friction-free redemption | Platform cost, fulfilment |
| Customer database with export | CAC reduction, data value | Marketing acquisition |
| Automated re-engagement emails | Retention | Staff and operations |
| Referral links and campaigns | CAC reduction | Marketing acquisition |
| Real-time reporting and redemption data | All levers (measurement) | Finance reconciliation time |
| Birthday offers | AOV, retention | Reward fulfilment |
For a café or salon running a 90-day pilot, Pintup’s QR-based onboarding means there is no hardware to procure and no app for customers to download, which removes two of the most common reasons small-venue pilots stall. The café loyalty programme and hair salon loyalty programme pages show venue-specific configurations.
The reporting exports Pintup provides cover member activity, redemption counts, and breakage data — precisely the three inputs a finance team will ask for in a QBR. Set up a matched holdout group of non-enrolled customers in your EPOS at launch, export both cohorts monthly, and you have the control-group comparison that makes incremental revenue defensible.
A conservative pilot scope for a single-site café: 200 enrolled members over 90 days, with 200 matched non-enrolled customers as the control group. Collect member avg spend, control avg spend, active member rate, redemption rate, and breakage. Those five numbers are enough to build the first version of the ROI spreadsheet from Section 3.
Key takeaways
A loyalty programme’s financial case rests on one number above all others: incremental revenue measured against a matched control group, not gross member spend.
| Point | Details |
|---|---|
| Use the correct ROI formula | ROI = (Incremental net profit − total programme cost) ÷ total programme cost × 100. |
| Four cost lines are non-negotiable | Points liability, platform subscription, fulfilment, and staff time must all appear on the ledger. |
| Plan for a multi-year horizon | Year 1 often shows marginal returns; the compounding retention benefit appears in Years 2 and 3. |
| Present scenarios, not a single estimate | Show conservative, base, and optimistic payback ranges so finance can assess robustness. |
| Pintup as a pilot route | Pintup’s QR-based, no-hardware platform generates the member activity and redemption data needed for a CFO-ready ROI case from day one. |
The gap between loyalty metrics and financial proof
Most loyalty programmes fail their finance review not because the economics are bad, but because the measurement was built to impress marketing rather than satisfy a CFO. Enrolment milestones, redemption counts, and member satisfaction scores are easy to report and easy to dismiss. Incremental spend against a control group is harder to build but almost impossible to argue with.
The 90-day pilot is the most underused tool in this space. It is not a compromise or a delay tactic but the fastest route from a budget request to a defensible approval, because it converts a theoretical argument into owned evidence with real numbers. CFOs who push back on loyalty investment are not wrong to do so. They are asking the right question: is this programme changing behaviour, or are we paying people who would have bought anyway? A well-structured pilot answers that question directly.
The other thing worth saying plainly: Year 1 ROI is almost never the right number to lead with. The compounding value of retention improvement takes 24–36 months to show up clearly in the P&L. Present a three-year model with a clear payback trajectory, show the sensitivity range, and let the numbers make the case.
Run a low-cost pilot and get CFO-ready numbers fast
Getting from “we think loyalty works” to “here is the incremental revenue and payback period” is the step most small hospitality businesses skip. Pintup makes that step straightforward.
No app, no hardware, no EPOS integration required. Customers scan a QR code, collect digital stamps, and you build a first-party customer database from day one. Automated re-engagement emails run without manual effort. Referral links reduce your acquisition cost. And the reporting dashboard exports the member activity, redemption, and breakage data your finance team will ask for in a QBR.
A 90-day pilot on Pintup costs a fraction of what a traditional loyalty scheme demands, and it produces the exact five inputs the ROI spreadsheet in this guide needs: member revenue, control-group revenue, contribution margin, total programme cost, and active member rate. That is enough to walk into a budget meeting with a defensible number.
Start a free trial and see how quickly a small venue can move from enrolment to evidence. Whether you run a café, pub, bar, or salon, the loyalty programme options by venue type show you exactly what a pilot looks like for your business.
Useful sources and further reading
The sources below are worth bookmarking if you are building a finance-grade loyalty business case.
- MIT Sloan — Loyalty Programme Liabilities and Point Values: the academic foundation for understanding how points liability and deferred revenue interact with operating performance. Useful for the accounting notes in any CFO presentation.
- Open Loyalty — How to calculate ROI for loyalty programmes: a practitioner-level walkthrough of the ROI formula with variable definitions and a worked example. Good for building your first spreadsheet.
- BCG — Leveraging the loyalty margin: the foundational piece on how programme design (tiering, reward generosity) affects incremental share and margin. Essential reading before you set tier thresholds.
- HBR — The value of keeping the right customers: the source behind the widely cited retention-to-profit relationship. Useful for framing the long-term CLV argument to a sceptical finance director.
- Brand Movers — CFO-ready business case template: a downloadable template structured around a three-year model with five financial levers and sensitivity scenarios. The closest thing to a ready-made finance pack for a loyalty programme.
- Spreadsheet template: build your own using the column structure in Section 3 of this guide, or request the Pintup ROI worksheet via the Pintup website. It includes fields for member count, control-group spend, contribution margin, all four cost lines, and a results tab that resolves ROI and payback automatically.